Note
Click here to download the full example code or to run this example in your browser via Binder
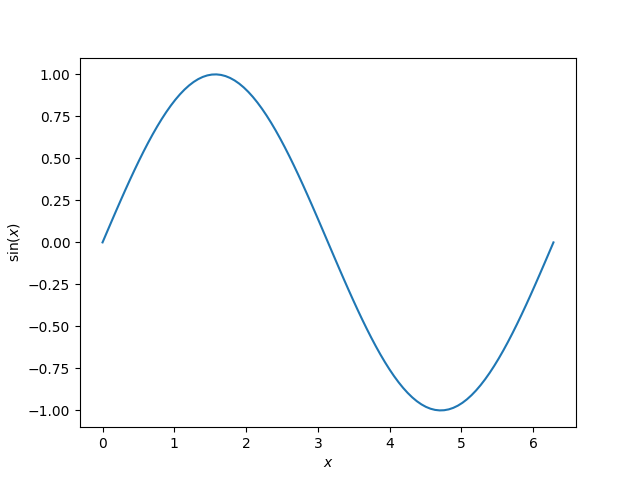
Tertiary example - Plotting sin3
This is a general example demonstrating a Matplotlib plot output, embedded rST, the use of math notation and cross-linking to other examples. It would be useful to compare with the output below.
Here the function \(\sin\) is evaluated at each point the variable \(x\) is defined.
import numpy as np
import matplotlib.pyplot as plt

x = np.linspace(0, 2 * np.pi, 100)
y = np.sin(x)

plt.plot(x, y)
plt.xlabel('$x$')
plt.ylabel('$\sin(x)$')
# To avoid matplotlib text output
plt.show()
To include embedded rST, use a line of >= 20 #’s or #%% between your
rST and your. This separates your example
into distinct text and code blocks. You can continue writing code below the
embedded rST text block:
print('This example shows a sin plot!')
Out:
This example shows a sin plot!
from py_qs_example.mymodule import ExampleClass, example_function, less_important_function
ec = ExampleClass(5)
ec
Out:
example
Out:
'example_test'
LaTeX syntax in the text blocks does not require backslashes to be escaped:
Cross referencing
You can refer to an example from any part of the documentation,
including from other examples. Sphinx-Gallery automatically creates reference
labels for each example. The label consists of the .py file name,
prefixed with sphx_glr_ and the name of the
folder(s) the example is in. In this case, the example we want to
cross-reference is in auto_examples (the gallery_dirs; see
Total running time of the script: ( 0 minutes 0.212 seconds)